Blog Dashboard (Analytics)
Written By inblog Team
Last updated About 1 year ago
You can access your blog’s analytics by clicking Dashboard from the left sidebar. This section provides a comprehensive overview of your blog’s performance.
Key Features
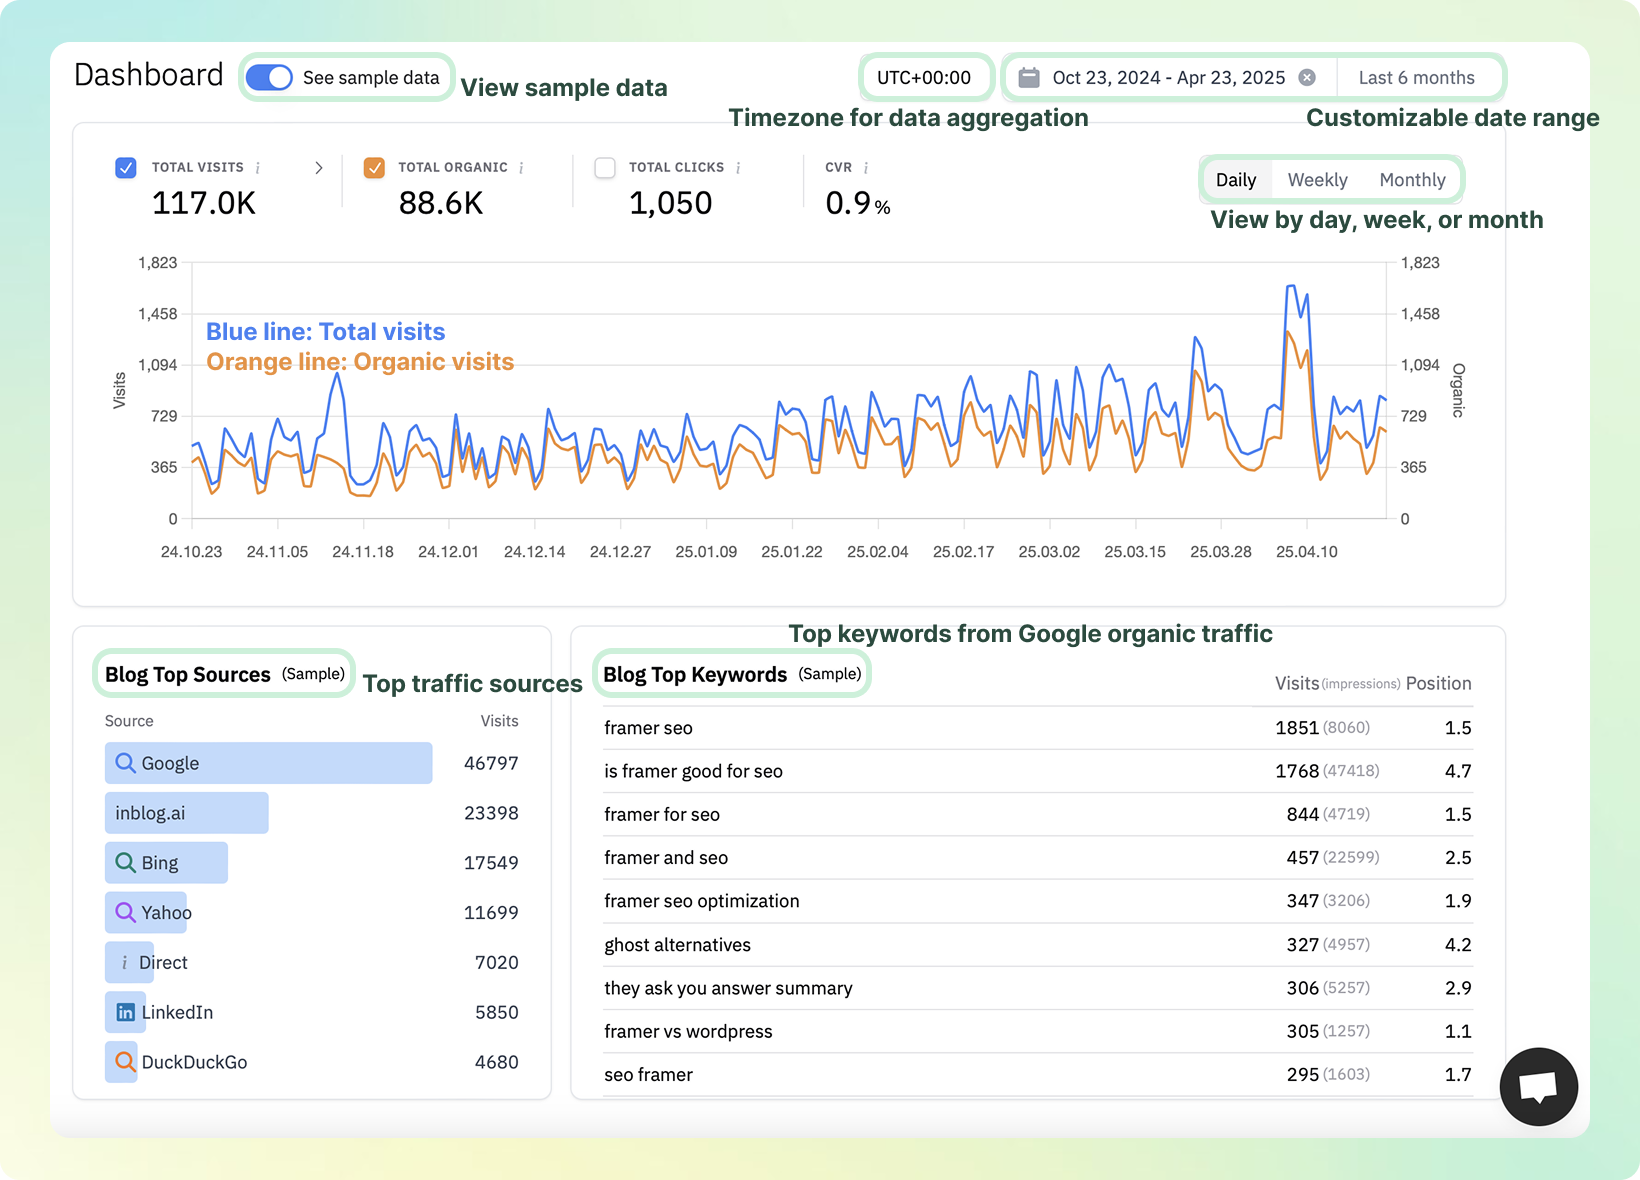
See Sample Data
Toggle sample data on/off from the top-left corner to explore how metrics are displayed.
Timezone Configuration
Set the reference timezone for all aggregated data.
Date Range Filter
Select the time range for which you’d like to view the data.
Daily / Weekly / Monthly Views
Analyze performance metrics by day, week, or month.
Overview Metrics
Total Visits
Total number of visitors to your blog.
Total Organic
Number of visitors arriving through organic search (Google, ChatGPT, etc.).
Total Clicks
Total number of CTA (Call-to-Action) button clicks across your blog.
CTA Conversion Rate (CVR)
Calculated as: CTA Clicks ÷ Total Visits
Top Sources
Traffic sources that drive the most visits to your blog (e.g., search engines, direct traffic, referrals).
Top Keywords
Keywords that brought users to your blog via search engines.
Visits: Number of sessions generated by each keyword
Impressions: How many times your blog appeared for each keyword
Position: Average Google ranking for the keyword
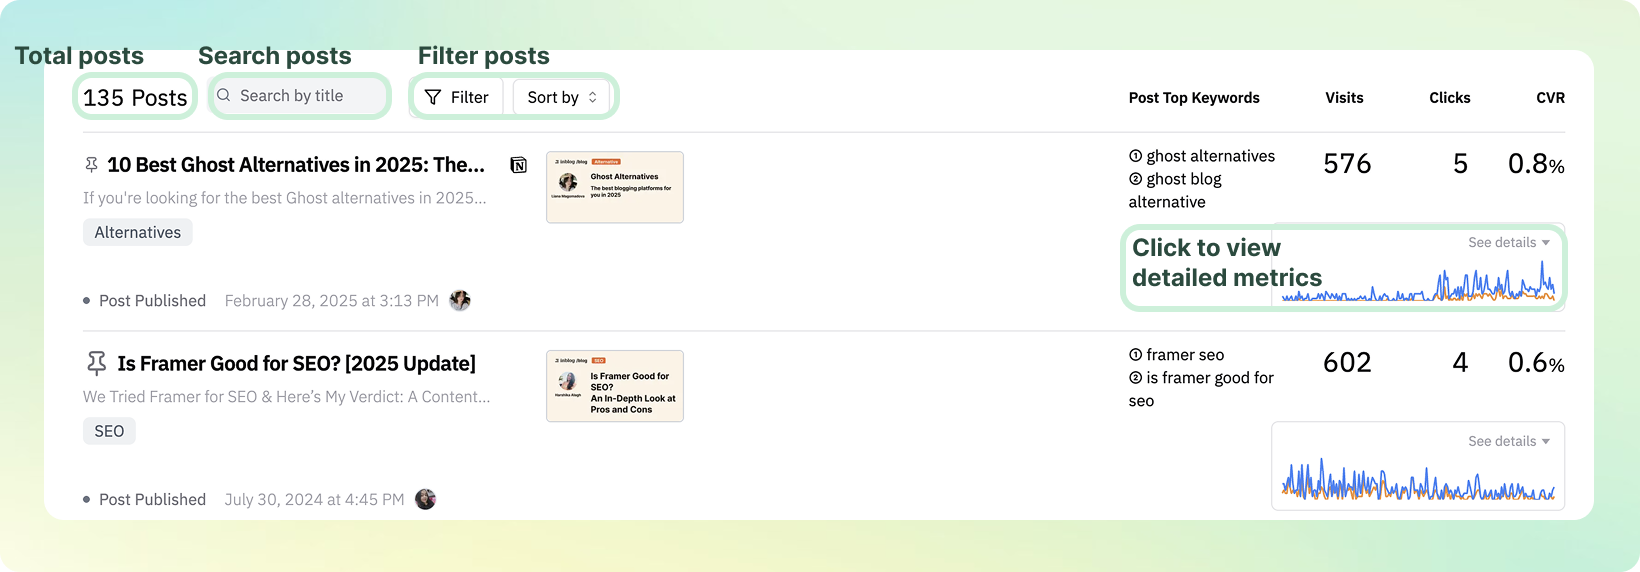
Post-Level Analytics
Scroll down to view individual post performance:
Visits: Pageviews per post
Clicks: CTA clicks per post
CVR: Conversion rate per post
If your blog is connected to Google Search Console, you’ll also see the keywords each post ranks for on Google.